

 Deutsch
 Español
 Français
 Hrvatski
 Italiano
 Polski
 Português (BR)
Viewing Statistics
Overview
View statistics of the tickets in your projects. How many projects you can view at the same time depends on how you have access to statistics:
- With the Statistics user permission, you view all projects, several projects or a single project at the same time.
- With the Statistics role permission, you view one of your projects at a time.
In both cases you can narrow the statistics to a single location, restrict them to a date range, and apply a saved ticket filter.
Access & Permissions
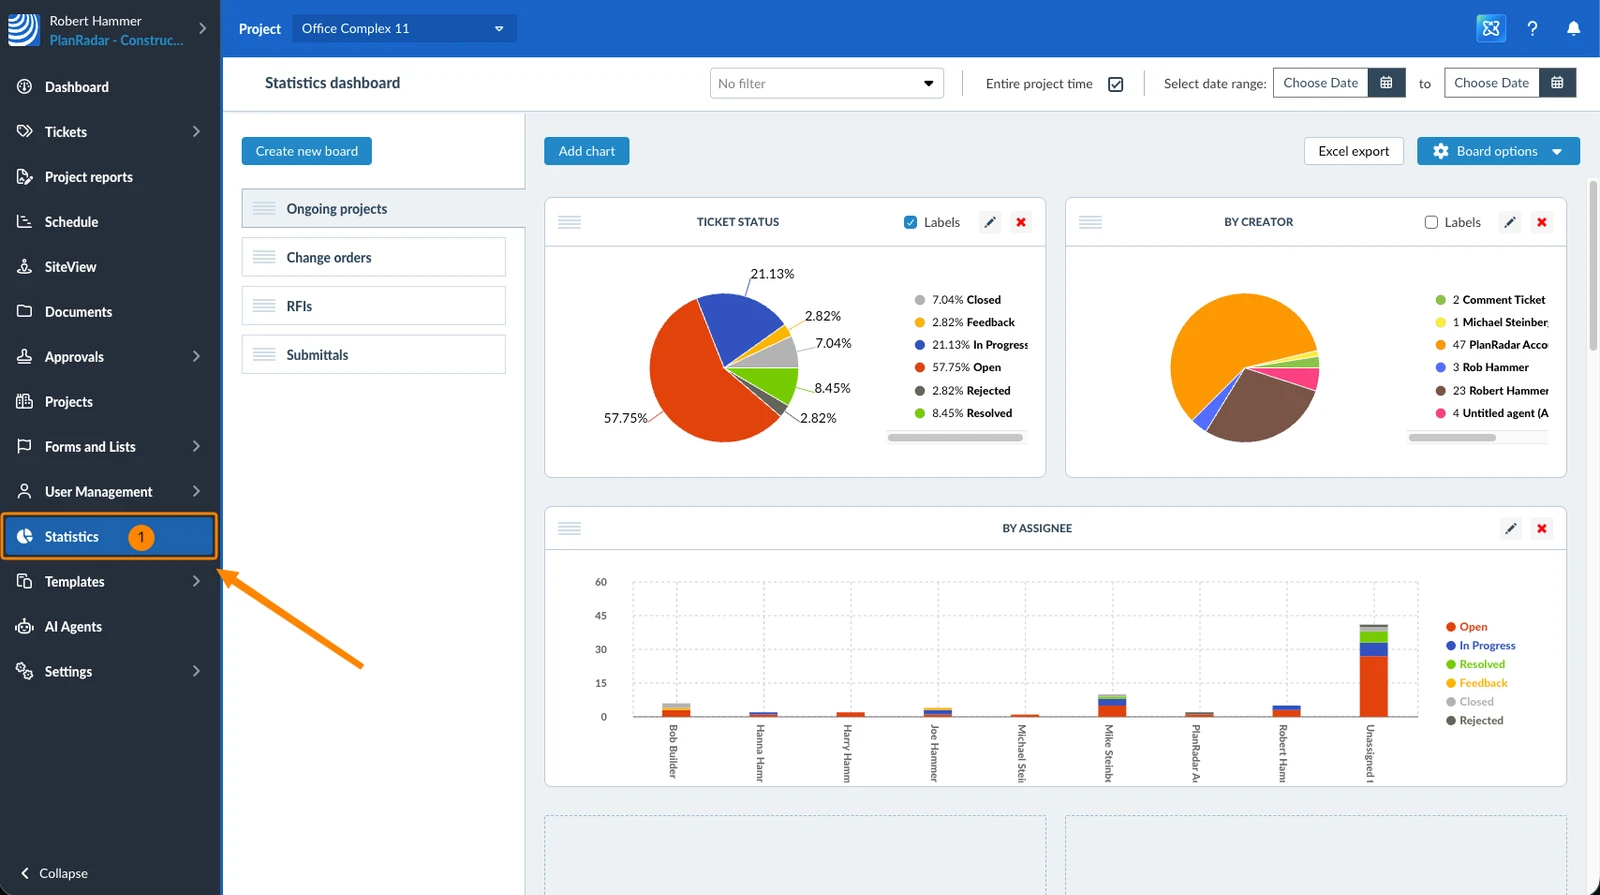
How to access Statistics
- Click Statistics
View Statistics of a Project or Location
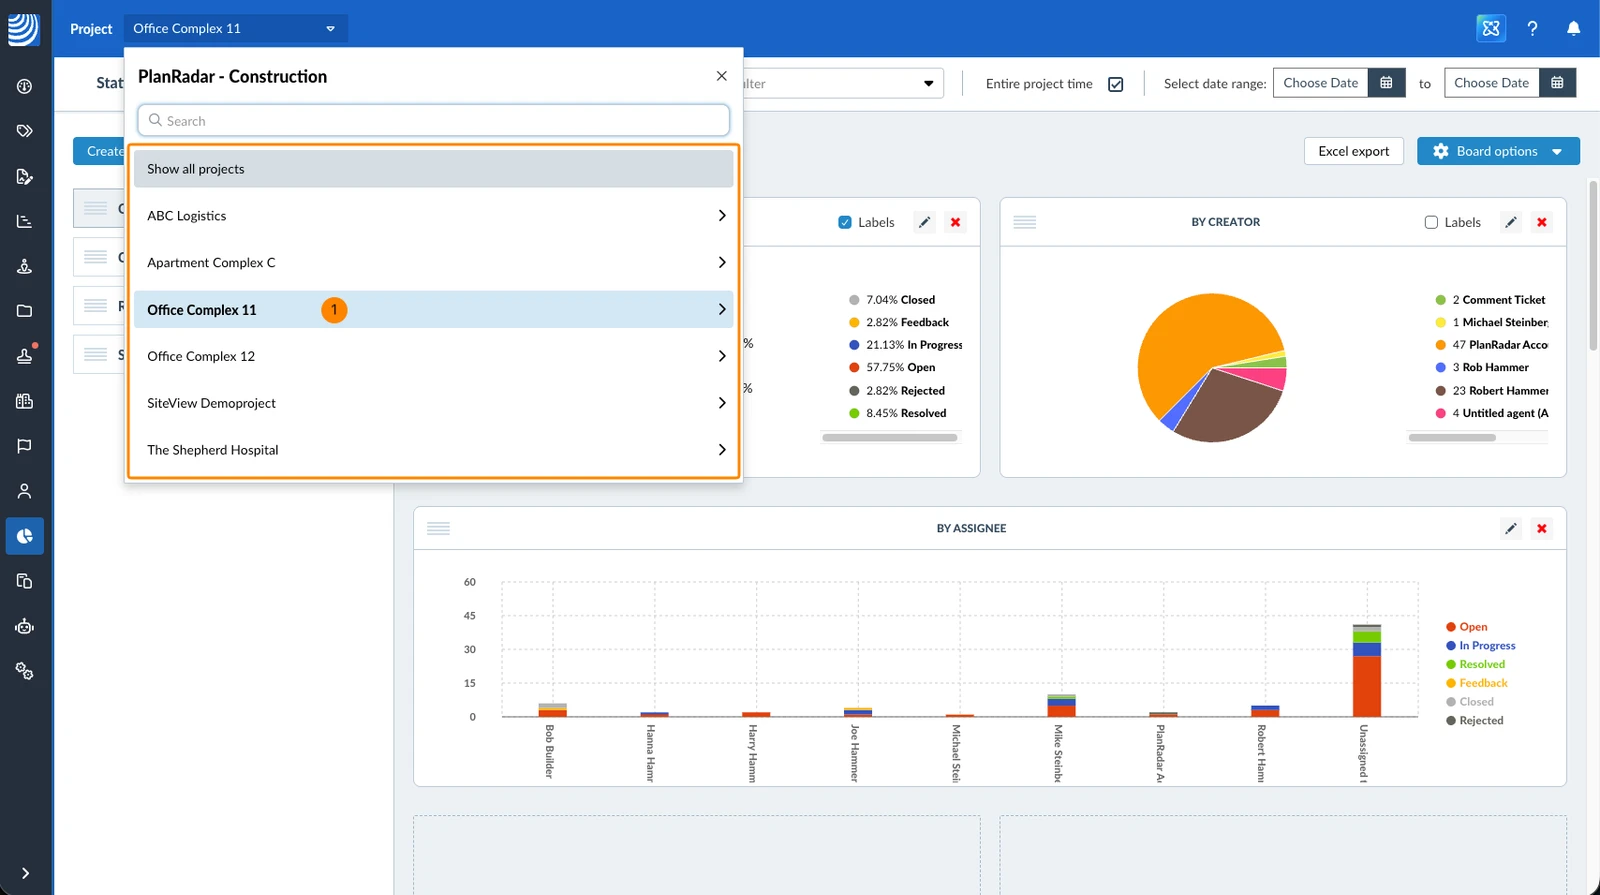
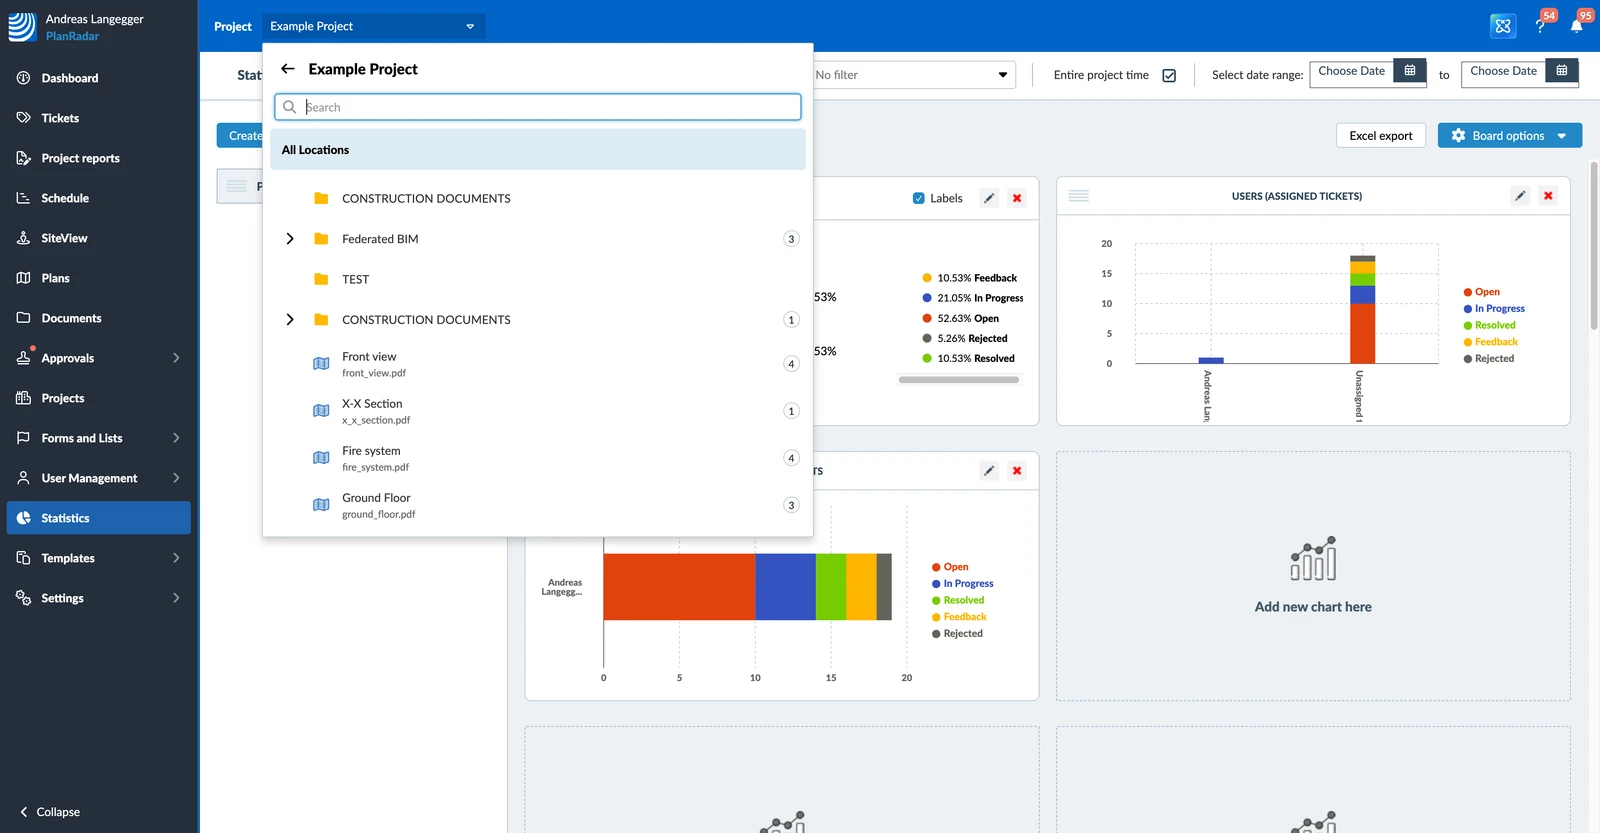
All charts on the board show the data of the project and location you select. To narrow the statistics down:
- Select a project, or Show all projects, from the Project drop-down
- Select a location of that project, or All locations
Statistics Through a Project Role
If you have access to statistics through your project role:
- The project drop-down lists only the projects where your role gives you statistics access.
- Show all projects cannot be selected.
- Opening Statistics without a project selected takes you to your first project.
The statistics of the selected project cover all tickets in it. Switching to another project changes both the data and the boards available to you.
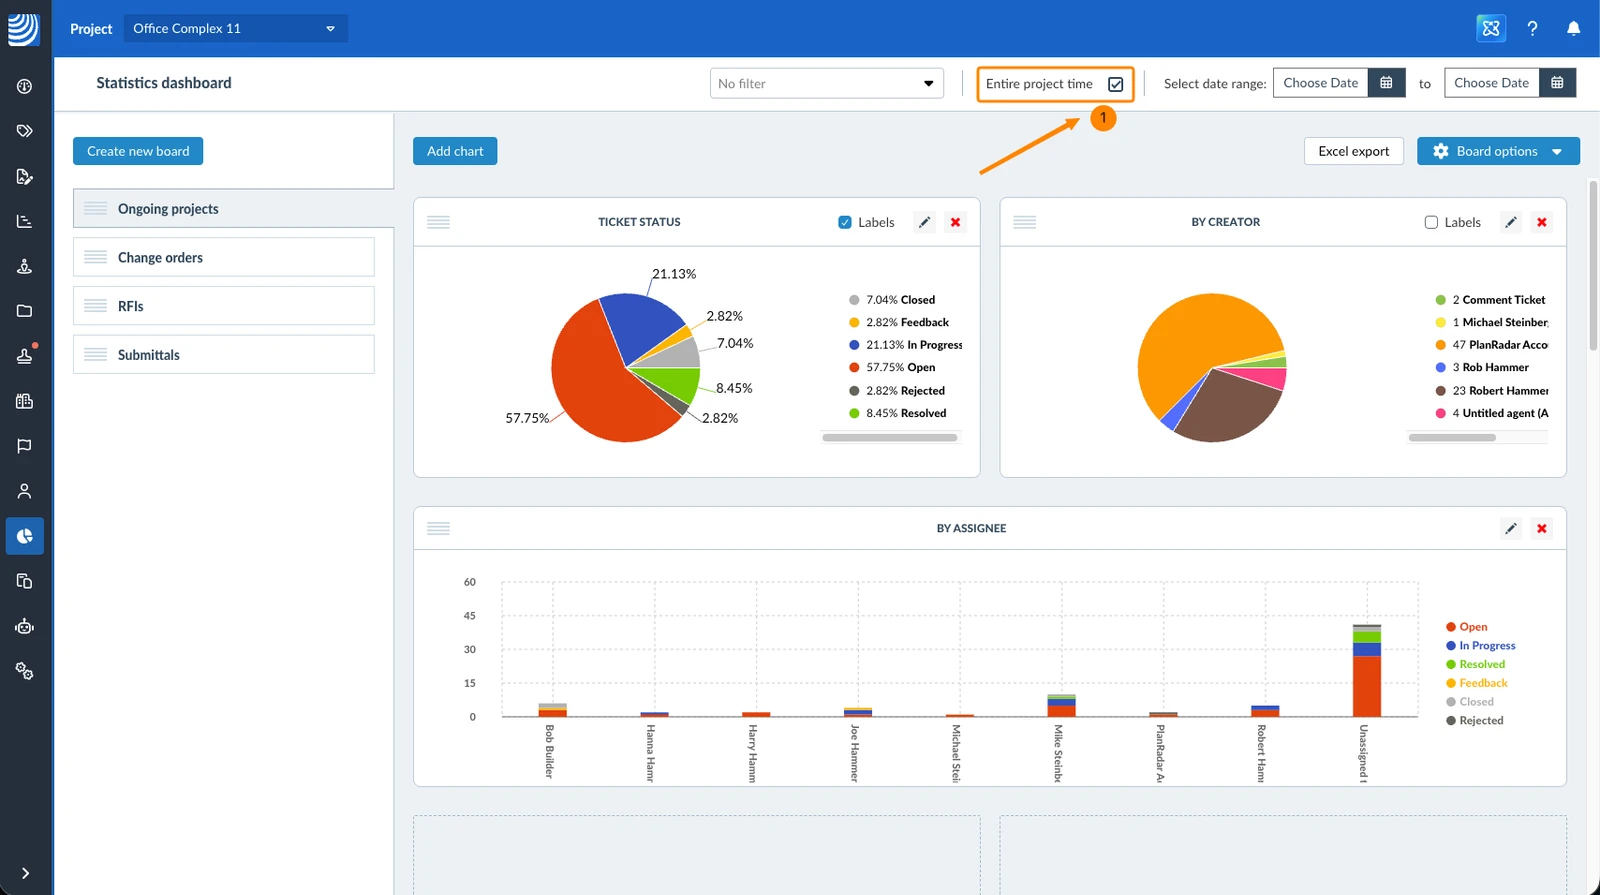
Show Statistics of a Certain Period
You can restrict statistics to tickets created within a specific time period. To do so:
- Use the date picker to select a time period
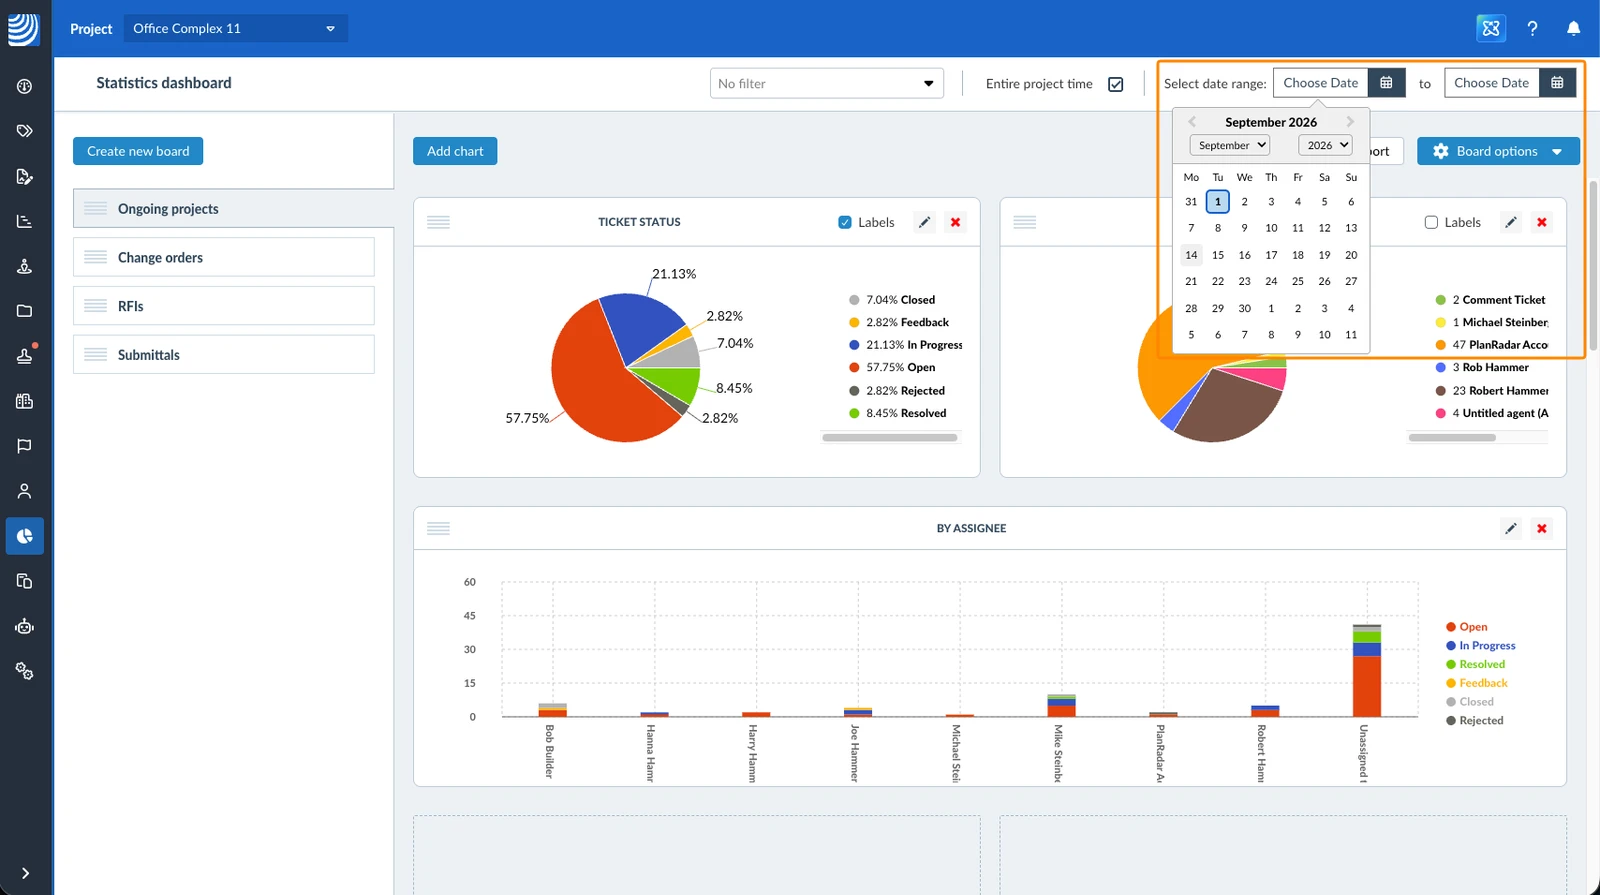
To show the entire project time:
- Select the Entire project time checkbox
Filter Tickets in Statistics
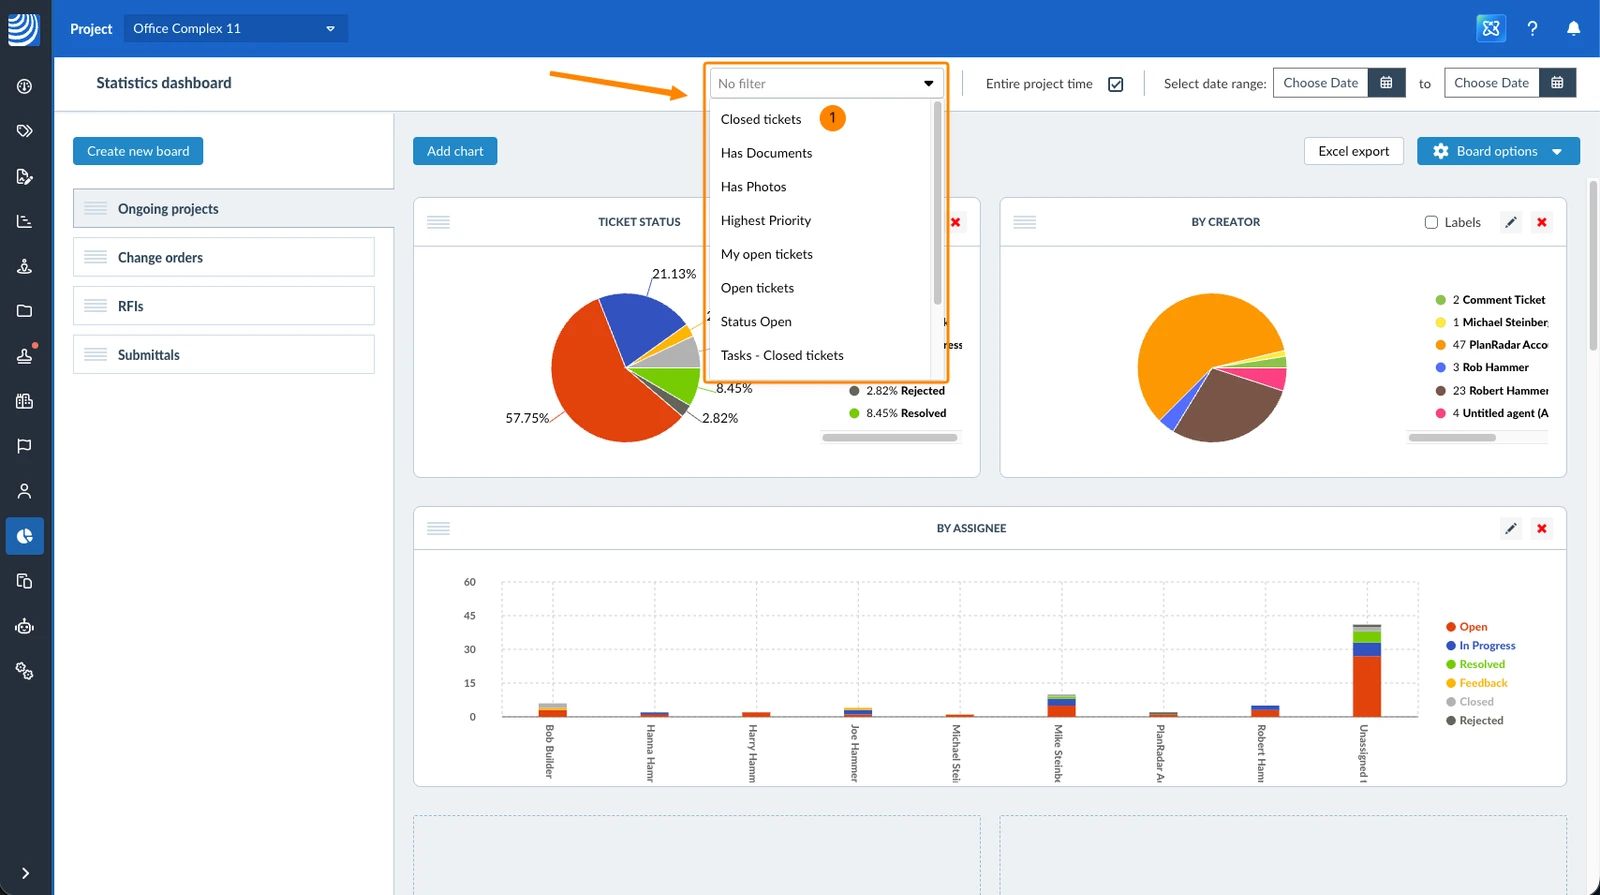
The statistics can be restricted to the tickets of a saved ticket filter. To do so:
- Select a saved filter from the filter drop-down
Updated September 4, 2026